
Executive Summary
This first of its kind study analyzed 850 venture capital (VC) firms’ team size, composition, and assets under management (AUM) from 2000 – 2022 to measure the impact Platform roles have on financial returns. Over the past two decades, Platform roles have increased at a higher rate than VC industry growth as a whole; and, a higher concentration of Platform roles is correlated to outsized returns in up and down market conditions. While VC firms do not necessarily need to invest in Platform roles to be successful, the data shows that when looking at the asset class as a whole, increased Platform investment contributes to stronger overall performance. Funds with higher levels of investment in Platform teams generally have higher Net IRR and TVPI compared to those that have no Platform based on pooled returns. The research was led by VC Platform Global Community, a trade organization dedicated to the advancement of the Platform profession.
The research supports two key findings:
The Platform Function has professionalized with over half of venture firms today having a Moderate or Significant platform team, nearly doubling in prevalence over the last two decades.
VC firms are increasingly investing in pre- and post-investment professionals to differentiate from competition and outperform market returns. Today, 52.8% of venture firms have Moderate or Significant Platform teams, double the proportion of firms that had Platform teams in 2000. Firms of all sizes invest in Platform, with large funds making an outsized investment; of firms over $1Bn in AUM, 92.7% currently have a Moderate or Significant Platform team. In 2022, one in eight core employees at a venture firm (13.1% of core team members) are focused on Platform, compared to one in sixteen (or 6.4%) in 2000.
Firms with Significant Platform produce 1,100 basis point improvements in Net IRR and 0.5x TVPI compared to firms with No Platform in the last decade.
The investment in Platform teams correlates to better fund returns. The data shows that VC funds that invest in pre-investment and/or post-investment Platform services report a higher return multiple and net IRR. Funds with Significant Platform have outperformed their peer funds with No Platform across nearly all vintage years over the last two decades; as the Platform function has come to maturity over the last 10 years, the difference in fund performance across these categorical cohorts is far more pronounced than in the early years of the century.
| 2000-2009 Fund Vintage Pooled Investment Returns | 2010-2019 Fund Vintage Pooled Investment Returns | Net Multiple (TVPI) | Net Multiple (TVPI) | |
|---|---|---|---|---|
| 8.4% Sample: 27 Funds Total Capital: $11.4Bn | Avg Fund Size: $421.6M | 1.7 x Sample: 27 Funds Total Capital: $11.7Bn | Avg Fund Size: $433.1M | 33.2% Sample: 147 Funds Total Capital: $42.9Bn | Avg Fund Size: $292.1M | 2.8 xSample: 132 Funds Total Capital: $40Bn | Avg Fund Size: $303.3M | |
| 7.2% Sample: 89 Funds Total Capital: $49.5Bn | Avg Fund Size: $556.2M | 1.8 x Sample: 89 Funds Total Capital: $51.8Bn | Avg Fund Size: $582.5M | 28.8% Sample: 137 Funds Total Capital: $60.7Bn | Avg Fund Size: $442.8M | 2.6 x Sample: 130 Funds Total Capital: $65.3Bn | Avg Fund Size: $502.1M | |
| 4.1% Sample: 140 Funds Total Capital: $39.7Bn | Avg Fund Size: $283.3M | 1.6 x Sample: 157 Funds Total Capital: $42.2Bn | Avg Fund Size: $268.7M | 22.2% Sample: 120 Funds Total Capital: $18.2B | Avg Fund Size: $151.4M | 2.3 x Sample: 123 Funds Total Capital: $18.7Bn | Avg Fund Size: $152.3M | |
| 6.1% Sample: 256 Funds Total Capital: $100.5Bn | Avg Fund Size: $392.8M | 1.7 x Sample: 273 Funds Total Capital: $105.7Bn | Avg Fund Size: $387.2M | 29.5% Sample: 404 Funds Total Capital: $121.8Bn | Avg Fund Size: $301.4M | 2.6 x Sample: 385 Funds Total Capital: $124.1Bn | Avg Fund Size: $322.2M | |
The color of the values in this table represents the distance of each value from the pooled return value for each analysis grouping, based on standard deviation.
Download PDF
Contributors


A Special Thank You to Our Sponsor, Zendesk
This study was made possible in large part thanks to Zendesk. Zendesk for Startups is passionate about finding innovative ways to bridge the resources large enterprise tech companies can offer and the support startup founders need as they pioneer the future of tech.

“Our team at Zendesk for Startups spends a great deal of time collaborating with VC Platform leaders, because we know these leaders are the conduits to impactfully supporting the startups in their portfolios. Whether it’s benchmarking performance, sharing studies on the latest trends in customer experience, workshopping operational issues one-on-one, or introducing founders to our network of executives, VC Platform specialists are the (often invisible) force helping us bring resources to their startups. When the opportunity to measure the positive impact these teams have on startup performance arose, we knew we had to be a part of it.”

Kristen Durham
SVP, SMB & StartupsZendeskIndustry Data
This report includes historical firm employee data sourced from LinkedIn and fund returns data sourced from Pitchbook and Preqin. More on the research methodology can be found here. The data in this report covers 850 venture firms including:


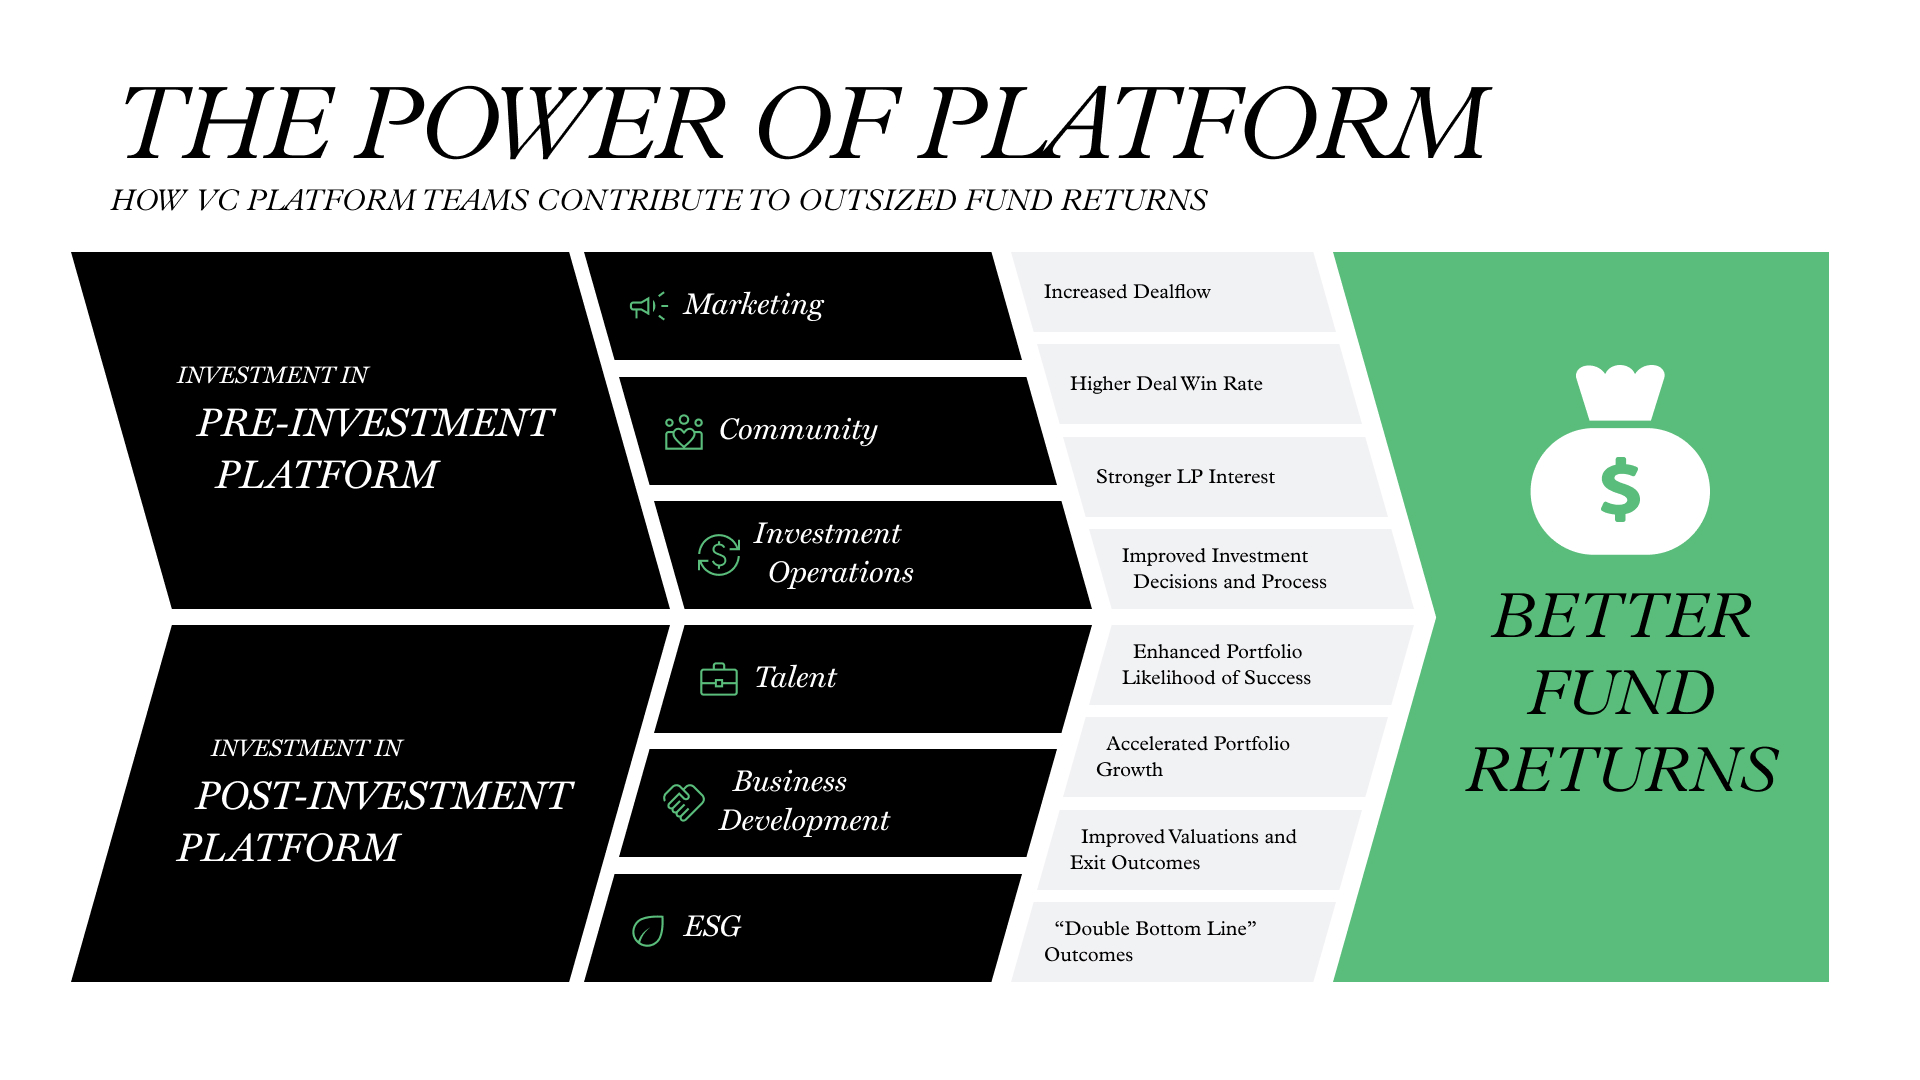
The Role of Platform
Platform is a broad category of roles focused on specific non-investment functions ranging from pre-investment firm goals (such as building the brand to better source new investments) to post-investment efforts (directly supporting portfolio companies).
This study classifies VC Platform into six categories (with a seventh “other” category for the broad, less defined roles):
Pre-Investment
Marketing
Leading the firm’s brand, including content creation, events, public relations and creative efforts. At times, also focused on supporting a firm’s portfolio companies.
Community
Building, cultivating and engaging a community of advisors or evangelists through events and/or digital spaces that support the firm on a regular basis that contribute to a firm’s dealflow,support portfolio companies and broad ecosystem strategy.
Investment Operations
Supporting the ongoing fund operations, including investor enablement, data driven sourcing, and investment efficiency. Frequently also supporting investor relations and fundraising.
Post-Investment
Talent
Portfolio focused efforts to support companies with recruiting, hiring, culture, DEI and other people-oriented efforts.
Post-investment Business Development
Efforts to build relationships and connections with entities that actively partner with portfolio companies as customers, go-to-market advisory, or potential acquirers.
ESG
Efforts to support portfolio companies and, in some cases, the firm itself in implementing and measuring Environmental, Social and Governance measurement, reporting and improvement including diversity and inclusion
Today, Platform is the fastest growing and one of the newest roles in the VC industry. Over half of all venture firms have invested in Platform and nearly 40% of firms currently have a Significant Platform team. While the first actual use of the term ‘Platform’ dates to 2010 – 2012 at some early adopting firms, the function itself has been around in venture for decades under different names or titles.
“From the earliest days at FirstMark, we’ve known that the value we bring to founders is more than just capital. There is a demonstrated demand to scale and productize the knowledge and networks we have built as a partnership so our founders can make smarter decisions, faster. Much like the value-additive consultative services offered in private equity, VC firms are responding to the needs of their portfolio and showing up to help build fund-returning businesses.”

Dan Kozikowski
Partner & Head of PlatformFirstMarkIn the first decade of the 21st century, Platform was still a rare function for firms to invest in. From 2000 to 2009, less than 1 in 3 venture firms had any Platform professionals on their teams. Then, as the economy recovered from the Great Recession of 2008 and the venture capital industry grew in size, the importance of Platform became more apparent. A key driver of the scaling of Platform has been the introduction of new models and approaches to venture.
The growth in the prevalence of Platform roles outpaced the increase in the number of venture firms and available capital. VC General Partners describe the growth in Platform being related to the need to differentiate amongst a more crowded industry of VCs where firms need to do more to ensure their brand stands out to win more of the best deals. And that post-investment, Platform support helps build successful companies in competitive markets. Platform is not only delivering support to portfolio founders and executives, but also building a firm’s brand, equating to more LP capital, stronger deal flow and deals won.
The Changing Profile of a VC Team
VC has changed dramatically over the past two decades. The number of firms, people and capital has grown significantly and the composition of VC teams has evolved. Team composition data from 850 venture firms over the last 22 years was analyzed, which surfaced three primary themes.
Larger Teams
From 2000 to 2022 the average venture fund grew their core team headcount by 124%. Funds with at least $2.5 billion in assets under management grew headcount by 248%.
More Non-investment Roles
As headcount grew, the growth also changed the composition of the typical venture firm. The most significant change was the relative decrease in size of the investment team and increase in the concentration of non-investment professionals.
In 2000, the average venture firm’s core team was 72.9% investors and 27.1% non-investment professionals (12.7% Finance, Tax & Accounting; 6.2% Platform; 2.1% Operations; 0.9% Legal & Compliance; 0.8% Research & Data Science; 4.4% Other).
In 2022, investors only make up an average 62.4% of the core team, with non-investment professionals now accounting for 37.6% of the firm. During this period, most non-investment roles (Finance, Tax & Accounting; Operations; Legal & Compliance; Research & Data Science; Other) have remained generally consistent, changing by 0.0% – 2.0% in headcount concentration, with one exception. The largest area of expanded team concentration was Platform, which now accounts for 12.9% of the average venture firm’s core team, more than doubling since 2000.
Evolution of VC Firm Composition
All Data
Less than $250M Assets Under Management
$250M - $500M Assets Under Management
$500M - $1.0Bn Assets Under Management
$1.0 - $2.5Bn Assets Under Management
$2.5Bn+ Assets Under Management
Increasing Size and Specialization of Platform Teams
The most significant change in team concentration was the growth in the number of Platform professionals. The trend was generally consistent regardless of fund size, with larger firms (based on total AUM) having, on average, concentrated an even greater percentage of their headcount on Platform than smaller firms.
In 2022, the average venture capital firm’s core team was 12.9% Platform professionals, at larger funds with over $1Bn in AUM that portion of Platform increased to 14.6% – 15.1% on average. Later sections will detail the impact of this increase on financial returns.
Platform as a Percentage of Total Firm Headcount
“Over the past decade, entrepreneurs’ expectations of their venture capital firms have completely evolved. There is no way VCs can deliver against these expectations without a significant investment in their platform. The best firms have been nimble in designing their platform programs and are continuously evolving their offerings to meet founders’ needs.”

Katie Hughes
Executive Talent PartnerGeneral CatalystPlatform Specialization
Platform has historically been a catch-all title, with one person at a firm doing a bit of everything under the Platform umbrella. But recently, the trend is firms hiring Platform Specialists who have deep expertise in one of the Platform focus areas where the firm is looking to have a bigger impact.
Historic data shows that early Platform Specialists across the industry were focused primarily on pre-investment areas; specifically Marketing and Investment Operations. Both specializations have grown (Marketing by 70.0%; Investment Operations by 201.0% in firms with one or more specialists, the most dramatic growth was post-investment focused specialists.
| Platform Specialization | % of Firm with 1+ FTE in 2000 N = 209 firms | % of Firm with 1+ FTE in 2022 N = 834 firms | Growth Percentage from 2000 to 2022 |
|---|---|---|---|
| 12.0% | 20.4% | +70% | |
| 9.6% | 28.9% | +201% | |
| 3.8% | 12.7% | +234% | |
| 2.4% | 9.6% | +300% | |
| — | 5.9% | N/A | |
| — | 1.3% | N/A |
| Platform Specialization | % of Firm with 1+ FTE in 2000 N = 59 firms | % of Firm with 1+ FTE in 2022 N = 316 firms | Growth Percentage from 2000 to 2022 |
|---|---|---|---|
| 6.8% | 10.1% | +49% | |
| 5.1% | 18.4% | +261% | |
| — | 3.5% | N/A | |
| 1.7% | 5.4% | +217% | |
| — | 3.2% | N/A | |
| — | 1.3% | N/A |
| Platform Specialization | % of Firm with 1+ FTE in 2000 N = 47 firms | % of Firm with 1+ FTE in 2022 N = 233 firms | Growth Percentage from 2000 to 2022 |
|---|---|---|---|
| 8.5% | 22.7% | +167% | |
| 12.8% | 36.1% | +182% | |
| — | 12.0% | N/A | |
| — | 10.7% | N/A | |
| — | 6.9% | N/A | |
| — | 1.7% | N/A |
| Platform Specialization | % of Firm with 1+ FTE in 2000 N = 28 firms ⓘ Small Sample Size | % of Firm with 1+ FTE in 2022 N = 834 firms | Growth Percentage from 2000 to 2022 |
|---|---|---|---|
| 42.9% | 56.9% | +33% | |
| 32.1% | 64.2% | +100% | |
| 17.9% | 50.4% | +182% | |
| 7.1% | 26.0% | +264% | |
| — | 17.1% | N/A | |
| — | 2.4% | N/A |
Talent (experts who support portfolio companies with hiring, culture, DEI and other people-oriented efforts) and Business Development (experts who partner with portfolio companies to help them connect with customers, partners and support their go-to-market strategies) were the largest sources of post-investment support change. In 2000, only 3.8% of firms had one or more full-time employees dedicated to Talent and only 2.4% had one or more full-time employees dedicated to Business Development. By 2022, 12.7% of firms have at least one Talent specialist on their team and 9.6% of firms have at least one Business Development specialist.
This trend is even more significant when looking at larger funds. In 2022, 50.4% of firms with over $1Bn in total AUM had one or more Talent Specialist (compared to 17.9% in 2000) and 26.0% had one or more Business Development Specialist (compared to 7.1% in 2000).
The final trend that emerged was the introduction of two relatively new, and increasingly prevalent, areas of Platform Specialization: Community and ESG. The very first Community dedicated Platform Specialist was identified in 2001, and today 5.9% of firms have at least one person dedicated to Community (17.1% of firms over $1Bn AUM).
Similarly, the first ESG-Focused Platform Specialist appeared in the data set in 2012. Today, 1.3% of firms now have at least one ESG Specialist on the team. Given the broader move in the market towards more environmentally and socially focused VC firms, it is likely a role that will continue to grow in the coming years.
All Data
Less than $250M Assets Under Management
$250M - $500M Assets Under Management
More than $1Bn Assets Under Management
“If venture as an industry is all about relationships, it's only natural that funds with functions dedicated to codifying and growing relationships outperform their peers. We've built and scaled our own platform on this premise, and on the belief that founders are experts in their core businesses and we can be the experts in everything else. Platform works best when we support the biggest moments in company building - fundraising, recruiting, marketing, organizational design, and business strategy.”

Stephanie Manning Cohen
Operating PartnerLerer HippeauDefining Platform Categories
In order to create a standardized set of terminology for each venture firm’s Platform efforts, this study categorizes venture funds based on their Platform Category. Platform Categories are assigned to funds based on the calculation of what percentage of the firm’s Core Team headcount are Platform professionals. For this analysis, a firm’s Core Team included individuals categorized as full-time permanent employees of the firm, excluding administrative staff. The percentages are calculated on a fund basis by taking the average Platform headcount percentage per year over the four-year investing period for each fund starting from vintage year. Each firm’s individual funds were assigned by vintage year into one of the following three categories:

In 2000, 74.2% of firms had No Platform and only 14.4% of firms were categorized as Significant Platform. In 2022 only 47.2% of firms had No Platform and 38.2% of firms were categorized as Significant Platform.
This trend is even more significant in firms with $1Bn or more in AUM. In 2000, 25.0% of larger firms had No Platform and only 32.1% had Significant Platform. In 2022, only 7.3% had No Platform and 65.0% were categorized as having Significant Platform.
Platform’s Impact on Fund Performance
For this study, fund returns data was sourced from Pitchbook and Preqin for 754 unique funds from 2000 - 2019 vintage years and then overlaid with each fund’s respective Platform Category, based on the framework above.
Fund Performance By Vintage Year
The first segment of analysis included in this study is looking at the impact of the Platform categories on fund returns based on vintage year. For this section of the analysis, there are a significant number of factors that must be considered, including global macroeconomic conditions and industry trends, which go beyond the scope of this specific research.
In general, the return profile across the venture capital asset class for funds in the first decade of the 21st century was not on par with the long term pooled average of the asset class and starkly different from how venture capital firms performed from 2010 to 2019. When looking at the set of funds within the vintage range of 2000 to 2009, the impact that Platform has on the funds pooled investment returns is modestly positive. Funds that fell in the Significant Platform category produced a Net IRR improvement of 430 basis points over funds that had No Platform and 230 basis points over the overall pooled average. On a TVPI basis, funds categorized as Significant Platform only outperformed No Platform by 0.1x and were on par with the overall pooled average. One important factor of these firms to call out is that over half of funds from 2000 to 2009 fell into the category of having No Platform, compared to only 30% of funds from 2010 to 2019.
For vintage year 2010 to 2019 funds, the impact of Platform becomes more pronounced, as has been seen throughout this study. An interesting observation in this data is that for this set of funds, the largest percentage of them (36.4%) are categorized as having Significant Platform; a significant shift from 10.0% of funds in the 2000 to 2009 vintage dataset. While the percentage of funds that fall into the Significant Platform Category has increased, that is also the category of funds with the strongest Pooled Net IRR and TVPI across all 2010 to 2019 vintage funds, with a Net IRR that is 1,100 basis points higher than those funds that have No Platform within those vintage years, and 390 basis points higher than the overall pooled average. TVPI improved by 0.5x compared to funds categorized as No Platform and 0.2x better than the overall pooled average.
| 2000-2009 Fund Vintage Pooled Investment Returns | 2010-2019 Fund Vintage Pooled Investment Returns | |||
|---|---|---|---|---|
| 8.4% Sample: 27 Funds Total Capital: $11.4Bn | Avg Fund Size: $421.6M | 1.7 x Sample: 27 Funds Total Capital: $11.7Bn | Avg Fund Size: $433.1M | 33.2% Sample: 147 Funds Total Capital: $42.9Bn | Avg Fund Size: $292.1M | 2.8 x Sample: 132 Funds Total Capital: $40Bn | Avg Fund Size: $303.3M | |
| 7.2% Sample: 89 Funds Total Capital: $49.5Bn | Avg Fund Size: $556.2M | 1.8 x Sample: 89 Funds Total Capital: $51.8Bn | Avg Fund Size: $582.5M | 28.8% Sample: 137 Funds Total Capital: $60.7Bn | Avg Fund Size: $442.8M | 2.6 x Sample: 130 Funds Total Capital: $65.3Bn | Avg Fund Size: $502.1M | |
| 4.1% Sample: 140 Funds Total Capital: $39.7Bn | Avg Fund Size: $283.3M | 1.6 x Sample: 157 Funds Total Capital: $42.2Bn | Avg Fund Size: $268.7M | 22.2% Sample: 120 Funds Total Capital: $18.2Bn | Avg Fund Size: $151.4M | 2.2 x Sample: 123 Funds Total Capital: $18.7Bn | Avg Fund Size: $152.3M | |
| 6.1% Sample: 256 Funds Total Capital: $100.5Bn | Avg Fund Size: $392.8M | 1.7 x Sample: 273 Funds Total Capital: $105.7Bn | Avg Fund Size: $387.2M | 29.4% Sample: 404 Funds Total Capital: $121.8Bn | Avg Fund Size: $301.4M | 2.6 x Sample: 385 Funds Total Capital: $124.1Bn | Avg Fund Size: $322.2M | |
Looking across 5 year cross sections provides even more detail on the impact of Platform. While the volume of data naturally gets less robust as we further segment the data, looking at more granular returns data in the context of overall trends in investment in Platform roles is critical to help understand the impact of increased vs decreased investment in Platform roles.
2000-2004
Fund returns with vintage years 2000 – 2004 were depressed with a pooled average Net IRR of 2.1% and TVPI of 1.3x. Return data shows that funds that were categorized as Significant Platform outperformed funds categorized as No Platform by 90 basis points and the overall pooled average by 100 basis points in net IRR. When comparing TVPI, the data is mixed in that funds categorized as Significant Platform marginally underperformed funds categorized as No Platform by 0.2x and the overall pooled average by 0.1x. This trend of mixed Platform correlated performance generally holds true across fund sizes as well during this vintage period. It’s important to remember that during this time period the sophistication and specialization of Platform roles was in its nascent stages of development. Additionally, the sample size of the detailed datasets in this time period, especially funds categorized as Significant Platform, are low for that reason.
| 2000-2004 | All Data | Pooled Investment ReturnsNET IRR | Pooled Investment ReturnsNet Multiple (TVPI) |
|---|---|---|
| 3.1% Sample: 12 Funds Total Capital: $5.5Bn | Avg Fund Size: $456M | 1.2 x
Sample: 13 Funds Total Capital: $5.9Bn | Avg Fund Size: $457.2M | |
| 1.8% Sample: 33 Funds Total Capital: $22.1Bn | Avg Fund Size: $670.8M | 1.2 x Sample: 33 Funds Total Capital: $23Bn | Avg Fund Size: $698.2M | |
| 2.2% Sample: 64 Funds Total Capital: $20.2Bn | Avg Fund Size: $315M | 1.4 x Sample: 71 Funds Total Capital: $21.4Bn | Avg Fund Size: $301.6M | |
| 2.1% Sample: 109 Funds Total Capital: $47.8Bn | Avg Fund Size: $438.3M | 1.3 x Sample: 117 Funds Total Capital: $50.4Bn | Avg Fund Size: $430.8M | |
| 2000-2004 | All Data | Less than $250M | $250M - $500M | More than $500M | Pooled Investment ReturnsNET IRR | Pooled Investment ReturnsNet Multiple (TVPI) | Pooled Investment ReturnsNET IRR | Pooled Investment ReturnsNet Multiple (TVPI) | Pooled Investment ReturnsNET IRR | Pooled Investment ReturnsNet Multiple (TVPI) | Pooled Investment ReturnsNET IRR | Pooled Investment ReturnsNet Multiple (TVPI) |
|---|---|---|---|---|---|---|---|---|
| Significant Platform | 3.1% Sample: 12 Funds Total Capital: $5.5Bn | Avg Fund Size: $456M | 1.2 x
Sample: 13 Funds Total Capital: $5.9Bn | Avg Fund Size: $457.2M | Small Data Sample 5.0% Sample: 5 FundsTotal Capital: $0.5Bn | Avg Fund Size: $104.4M | Small Data Sample 1.3 x
Sample: 5 FundsTotal Capital: $0.6Bn | Avg Fund Size: $114.6M | Small Data Sample 5.7% Sample: 2 FundsTotal Capital: $0.8Bn | Avg Fund Size: $400M | Small Data Sample 0.9 x
Sample: 3 FundsTotal Capital: $1.2Bn | Avg Fund Size: $406.7M | Small Data Sample 2.3% "Sample: 5 FundsTotal Capital: $4.2Bn | Avg Fund Size: $830M" | Small Data Sample 1.2 x Sample: 5 FundsTotal Capital: $4.2Bn | Avg Fund Size: $830M |
| Moderate Platform | 1.8% Sample: 33 Funds Total Capital: $22.1Bn | Avg Fund Size: $670.8M | 1.2 x Sample: 33 Funds Total Capital: $23Bn | Avg Fund Size: $698.2M | 4.2% Sample: 8 Funds Total Capital: $1.2Bn | Avg Fund Size: $153.9M | 1.5 x Sample: 7 Funds Total Capital: $1.2Bn | Avg Fund Size: $170.7M | Small Data Sample 1.0%
Sample: 6 FundsTotal Capital: $2.5Bn | Avg Fund Size: $409.1M | Small Data Sample 1.1 x
Sample: 5 FundsTotal Capital: $2.1Bn | Avg Fund Size: $410.9M | 1.7%
Sample: 19 Funds Total Capital: $18.5Bn | Avg Fund Size: $971.2M | 1.2 x Sample: 21 Funds Total Capital: $19.8Bn | Avg Fund Size: $942.5M |
| No Platform | 2.2% Sample: 64 Funds Total Capital: $20.2Bn | Avg Fund Size: $315M | 1.4 x Sample: 71 Funds Total Capital: $21.4Bn | Avg Fund Size: $301.6M | 4.9% Sample: 36 Funds Total Capital: $4.2Bn | Avg Fund Size: $117.8M | 2.0 x Sample: 41 Funds Total Capital: $4.4Bn | Avg Fund Size: $107.9M | 0.9% Sample: 16 Funds Total Capital: $5.8Bn | Avg Fund Size: $359.7M | 1.3 x Sample: 18 Funds Total Capital: $6.4Bn | Avg Fund Size: $357.9M | 1.8% Sample: 12 Funds Total Capital: $10.2Bn | Avg Fund Size: $847.2M | 1.1 x Sample: 12 Funds Total Capital: $10.6Bn | Avg Fund Size: $879.3M |
| All Data Pooled Return | 2.1% Sample: 109 Funds Total Capital: $47.8Bn | Avg Fund Size: $438.3M | 1.3 x Sample: 117 Funds Total Capital: $50.4Bn | Avg Fund Size: $430.8M | 4.7% Sample: 49 Funds Total Capital: $6Bn | Avg Fund Size: $122.3M | 1.9 x Sample: 53 Funds Total Capital: $6.2Bn | Avg Fund Size: $116.8M | 1.3% Sample: 24 Funds Total Capital: $9Bn | Avg Fund Size: $375.4M | 1.2 x Sample: 26 Funds Total Capital: $9.7Bn | Avg Fund Size: $373.7M | 1.8% Sample: 36 Funds Total Capital: $32.8Bn | Avg Fund Size: $910.2M | 1.2x Sample: 38 Funds Total Capital: $34.5Bn | Avg Fund Size: $907.7M |
2005-2009
Fund returns from vintage years 2005 – 2009 had a pooled average Net IRR of 9.8% and TVPI of 2.1x. Return data shows that funds that were categorized as Significant Platform outperformed funds categorized as No Platform by 720 basis points and the overall pooled average by 350 basis points in net IRR. When comparing TVPI, funds categorized as Significant Platform outperformed funds categorized as No Platform by 0.4x and the overall pooled average by 0.2x. This trend of Platform correlated overperformance generally holds true across fund sizes as well during this vintage period.
| 2005-2009 | All Data | Pooled Investment ReturnsNET IRR | Pooled Investment ReturnsNet Multiple (TVPI) |
|---|---|---|
| 13.3% Sample: 15 Funds Total Capital: $5.9Bn | Avg Fund Size: $394.1M | 2.3 x Sample: 14 Funds Total Capital: $5.7Bn | Avg Fund Size: $410.7M | |
| 11.7% Sample: 56 Funds Total Capital: $27.4Bn | Avg Fund Size: $488.7M | 2.3 x Sample: 56 Funds Total Capital: $28.8Bn | Avg Fund Size: $514.4M | |
| 6.1% Sample: 76 Funds Total Capital: $19.5Bn | Avg Fund Size: $256.6M | 1.9 x Sample: 86 Funds Total Capital: $20.8Bn | Avg Fund Size: $241.4M | |
| 9.8% Sample: 147 Funds Total Capital: $52.8Bn | Avg Fund Size: $359M | 2.1 x Sample: 156 Funds Total Capital: $55.3Bn | Avg Fund Size: $354.6M | |
| 2005-2009 | All Data | Less than $250M | $250M - $500M | More than $500M | Pooled Investment ReturnsNet IRR | Pooled Investment ReturnsNet Multiple (TVPI) | Pooled Investment ReturnsNet IRR | Pooled Investment ReturnsNet Multiple (TVPI) | Pooled Investment ReturnsNet IRR | Pooled Investment ReturnsNet Multiple (TVPI) | Pooled Investment ReturnsNet IRR | Pooled Investment ReturnsNet Multiple (TVPI) |
|---|---|---|---|---|---|---|---|---|
| 13.3% Sample: 15 Funds Total Capital: $5.9Bn | Avg Fund Size: $394.1M | 2.3 x Sample: 14 Funds Total Capital: $5.7Bn | Avg Fund Size: $410.7M | Small Data Sample 18.5% Sample: 6 FundsTotal Capital: $0.8Bn | Avg Fund Size: $129.9M | Small Data Sample 3.6 x Sample: 5 FundsTotal Capital: $0.6Bn | Avg Fund Size: $123.5M | Small Data Sample 14.1% Sample: 6 FundsTotal Capital: $2.2Bn | Avg Fund Size: $361.7M | Small Data Sample 2.4 x
Sample: 6 FundsTotal Capital: $2.2Bn | Avg Fund Size: $361.7 | Small Data Sample 11.4% Sample: 3 FundsTotal Capital: $3Bn | Avg Fund Size: $987.3M | Small Data Sample
2.0 x
Sample: 3 FundsTotal Capital: $3Bn | Avg Fund Size: $987.3M | |
| 11.7% Sample: 56 Funds Total Capital: $27.4Bn | Avg Fund Size: $488.7M | 2.3 x Sample: 56 Funds Total Capital: $28.8Bn | Avg Fund Size: $514.4M | 13.1% Sample: 21 Funds Total Capital: $3Bn | Avg Fund Size: $141.5M | 3.3 x
Sample: 18 Funds Total Capital: $2.7Bn | Avg Fund Size: $152.4M | 9.2% Sample: 20 Funds Total Capital: $7.1Bn | Avg Fund Size: $356M | 2.1 x
Sample: 22 Funds Total Capital: $8Bn | Avg Fund Size: $363M | 12.4% Sample: 15 Funds Total Capital: $17.3Bn | Avg Fund Size: $1151.7M | 2.2 x
Sample: 16 Funds Total Capital: $18.1Bn | Avg Fund Size: $1129.7M | |
| 6.1% Sample: 76 Funds Total Capital: $19.5Bn | Avg Fund Size: $256.6M | 1.9 x Sample: 86 Funds Total Capital: $20.8Bn | Avg Fund Size: $241.4M | 4.6%
Sample: 41 Funds Total Capital: $4.5Bn | Avg Fund Size: $108.7M | 2.3 x
Sample: 51 Funds Total Capital: $5.4Bn | Avg Fund Size: $106.3M | 6.3%
Sample: 30 Funds Total Capital: $10.2Bn | Avg Fund Size: $339.1M | 1.8 x
Sample: 29 Funds Total Capital: $10Bn | Avg Fund Size: $343.5M | Small Data Sample
7.1%
Sample: 5 FundsTotal Capital: $4.9Bn | Avg Fund Size: $974.2M | Small Data Sample
1.6 x
Sample: 6 FundsTotal Capital: $5.4Bn | Avg Fund Size: $896.8M | |
| All Data Pooled Return | 9.8% Sample: 147 Funds Total Capital: $52.8Bn | Avg Fund Size: $359M | 2.1 x Sample: 156 Funds Total Capital: $55.3Bn | Avg Fund Size: $354.6M | 9.0% Sample: 68 Funds Total Capital: $8.2Bn | Avg Fund Size: $120.7M | 2.7 x Sample: 74 Funds Total Capital: $8.8Bn | Avg Fund Size: $118.6M | 8.3% Sample: 56 Funds Total Capital: $19.5Bn | Avg Fund Size: $347.5M | 2.0 x Sample: 57 Funds Total Capital: $20.1Bn | Avg Fund Size: $353M | 11.3% Sample: 23 Funds Total Capital: $25.1Bn | Avg Fund Size: $1091.7M | 2.1 x Sample: 25 Funds Total Capital: $26.4Bn | Avg Fund Size: $1056.7M |
2010-2014
Fund returns from vintage years 2010 – 2014 had a pooled average Net IRR of 21.6% and TVPI of 3.4x. Return data shows that funds that were categorized as Significant Platform outperformed funds categorized as No Platform by 980 basis points and the overall pooled average by 410 basis points in net IRR. When comparing TVPI, funds categorized as Significant Platform outperformed funds categorized as No Platform by 1.3x and the overall pooled average by 0.5x. This trend of Platform correlated overperformance generally holds true across fund sizes as well during this vintage period.
| 2010-2014 | All Data | Pooled Investment ReturnsNet IRR | Pooled Investment ReturnsNet Multiple (TVPI) |
|---|---|---|
| 25.7% Sample: 40 Funds Total Capital: $11.4Bn | Avg Fund Size: $285.5M | 3.9 x Sample: 38 Funds Total Capital: $10.8Bn | Avg Fund Size: $285.3M | |
| 21.6% Sample: 61 Funds Total Capital: $23.1Bn | Avg Fund Size: $379.3M | 3.5 x Sample: 57 Funds Total Capital: $24.4Bn | Avg Fund Size: $428M | |
| 15.9% Sample: 62 Funds Total Capital: $8Bn | Avg Fund Size: $129.6M | 2.4 x Sample: 61 Funds Total Capital: $8.1Bn | Avg Fund Size: $133.6M | |
| 21.6% Sample: 163 Funds Total Capital: $42.6Bn | Avg Fund Size: $261.3M | 3.4 x Sample: 156 Funds Total Capital: $43.4Bn | Avg Fund Size: $278.1M | |
| 2010 - 2014 | All Data | Less than $250M | $250M - $500M | More than $500M | Pooled Investment ReturnsNet IRR | Pooled Investment ReturnsNet Multiple (TVPI) | Pooled Investment ReturnsNet IRR | Pooled Investment ReturnsNet Multiple (TVPI) | Pooled Investment ReturnsNet IRR | Pooled Investment ReturnsNet Multiple (TVPI) | Pooled Investment ReturnsNet IRR | Pooled Investment ReturnsNet Multiple (TVPI) |
|---|---|---|---|---|---|---|---|---|
| 25.7% Sample: 40 Funds Total Capital: $11.4Bn | Avg Fund Size: $285.5M | 3.9 x Sample: 38 Funds Total Capital: $10.8Bn | Avg Fund Size: $285.3M | 25.1% Sample: 22 Funds Total Capital: $2.3Bn | Avg Fund Size: $103.7M | 4.9 x Sample: 22 Funds Total Capital: $2.2Bn | Avg Fund Size: $97.9M | 24.8% Sample: 14 Funds Total Capital: $5.4Bn | Avg Fund Size: $384.2M | 3.7 x Sample: 12 Funds Total Capital: $4.4Bn | Avg Fund Size: $369.9M | Small Data Sample 27.4% Sample: 4 FundsTotal Capital: $3.8Bn | Avg Fund Size: $939.6M | Small Data Sample 3.6 x Sample: 4 FundsTotal Capital: $4.2Bn | Avg Fund Size: $1062M | |
| 21.6% Sample: 61 Funds Total Capital: $23.1Bn | Avg Fund Size: $379.3M | 3.5 x Sample: 57 Funds Total Capital: $24.4Bn | Avg Fund Size: $428M | 15.9% Sample: 22 Funds Total Capital: $2.5Bn | Avg Fund Size: $115.1M | 3.6 x Sample: 18 Funds Total Capital: $2.1Bn | Avg Fund Size: $117.2M | 23.4% Sample: 24 Funds Total Capital: $8.9Bn | Avg Fund Size: $372.6M | 4.0 x Sample: 23 Funds Total Capital: $8.4Bn | Avg Fund Size: $365M | 21.5% Sample: 15 Funds Total Capital: $11.7Bn | Avg Fund Size: $777.4M | 3.1 x Sample: 16 Funds Total Capital: $13.9Bn | Avg Fund Size: $868.2M | |
| 15.9% Sample: 62 Funds Total Capital: $8Bn | Avg Fund Size: $129.6M | 2.4 x Sample: 61 Funds Total Capital: $8.1Bn | Avg Fund Size: $133.6M | 18.8% Sample: 54 Funds Total Capital: $4.7Bn | Avg Fund Size: $86.4M | 2.9 x Sample: 52 Funds Total Capital: $4.4Bn | Avg Fund Size: $84.7M | 14.1% Sample: 6 Funds Total Capital: $1.9Bn | Avg Fund Size: $310.9M | 1.8 x Sample: 7 Funds Total Capital: $2.2Bn | Avg Fund Size: $320.6M | Small Data Sample 9.2% Sample: 2 FundsTotal Capital: $1.5Bn | Avg Fund Size: $750M | Small Data Sample 1.8 x Sample: 2 FundsTotal Capital: $1.5Bn | Avg Fund Size: $750M | |
| All Data Pooled Return | 21.6% Sample: 163 Funds Total Capital: $42.6Bn | Avg Fund Size: $261.3M | 3.4 x Sample: 156 Funds Total Capital: $43.4Bn | Avg Fund Size: $278.1M | 19.6% Sample: 98 Funds Total Capital: $9.5Bn | Avg Fund Size: $96.7M | 3.6 x Sample: 92 Funds Total Capital: $8.7Bn | Avg Fund Size: $94.2M | 22.8% Sample: 44 Funds Total Capital: $16.2Bn | Avg Fund Size: $367.8M | 3.6 x Sample: 42 Funds Total Capital: $15.1Bn | Avg Fund Size: $359M | 21.7% Sample: 21 Funds Total Capital: $16.9Bn | Avg Fund Size: $805.7M | 3.1 x Sample: 22 Funds Total Capital: $19.6Bn | Avg Fund Size: $892.7M |
2015-2019
Fund returns from vintage years 2015 – 2019 had a pooled average Net IRR of 33.5% and TVPI of 2.2x. Return data shows that funds that were categorized as Significant Platform outperformed funds categorized as No Platform by 870 basis points and the overall pooled average by 240 basis points in net IRR. When comparing TVPI, funds categorized as Significant Platform outperformed funds categorized as No Platform by 0.4x and the overall pooled average by 0.2x. This trend of Platform correlated overperformance generally holds true across fund sizes as well during this vintage period.
| 2015-2019 | All Data | Pooled Investment ReturnsNet IRR | Pooled Investment ReturnsNet Multiple (TVPI) |
|---|---|---|
| 35.9% Sample: 107 Funds Total Capital: $31.5Bn | Avg Fund Size: $294.6M | 2.4 x Sample: 94 Funds Total Capital: $29.2Bn | Avg Fund Size: $310.6M | |
| 33.2% Sample: 76 Funds Total Capital: $37.5Bn | Avg Fund Size: $493.9M | 2.2 x Sample: 73 Funds Total Capital: $40.9Bn | Avg Fund Size: $560M | |
| 27.2% Sample: 58 Funds Total Capital: $10.1Bn | Avg Fund Size: $174.8M | 2.0 x Sample: 62 Funds Total Capital: $10.6Bn | Avg Fund Size: $170.8M | |
| 33.5% Sample: 241 Funds Total Capital: $79.2Bn | Avg Fund Size: $328.6M | 2.2 x Sample: 229 Funds Total Capital: $80.7Bn | Avg Fund Size: $352.3M | |
| 2015-2019 | All Data | Less than $250M | $250M - $500M | More than $500M | Pooled Investment ReturnsNet IRR | Pooled Investment ReturnsNet Multiple (TVPI) | Pooled Investment ReturnsNet IRR | Pooled Investment ReturnsNet Multiple (TVPI) | Pooled Investment ReturnsNet IRR | Pooled Investment ReturnsNet Multiple (TVPI) | Pooled Investment ReturnsNet IRR | Pooled Investment ReturnsNet Multiple (TVPI) |
|---|---|---|---|---|---|---|---|---|
| 35.9% Sample: 107 Funds Total Capital: $31.5Bn | Avg Fund Size: $294.6M | 2.4 x Sample: 94 Funds Total Capital: $29.2Bn | Avg Fund Size: $310.6M | 36.2% Sample: 64 Funds Total Capital: $7.1Bn | Avg Fund Size: $111.6M | 2.6 x Sample: 51 Funds Total Capital: $5.5Bn | Avg Fund Size: $107.9M | 38.3% Sample: 24 Funds Total Capital: $8.7Bn | Avg Fund Size: $362.1M | 2.4x Sample: 27 Funds Total Capital: $9.7Bn | Avg Fund Size: $359.7M | 34.5% Sample: 19 Funds Total Capital: $15.7Bn | Avg Fund Size: $825.7M | 2.3 x Sample: 16 Funds Total Capital: $14Bn | Avg Fund Size: $873.8M | |
| 33.2% Sample: 76 Funds Total Capital: $37.5Bn | Avg Fund Size: $493.9M | 2.2 x Sample: 73 Funds Total Capital: $40.9Bn | Avg Fund Size: $560M | 23.8% Sample: 29 Funds Total Capital: $3.8Bn | Avg Fund Size: $129.6M | 2.2 x Sample: 23 Funds Total Capital: $2.9Bn | Avg Fund Size: $125.6M | 29.7% Sample: 29 Funds Total Capital: $10.5Bn | Avg Fund Size: $363M | 2.0 x Sample: 27 Funds Total Capital: $9.7Bn | Avg Fund Size: $358.6M | 36.3% Sample: 18 Funds Total Capital: $23.2Bn | Avg Fund Size: $1291.6M | 2.2 x Sample: 23 Funds Total Capital: $28.3Bn | Avg Fund Size: $1230.9M | |
| 27.2% Sample: 58 Funds Total Capital: $10.1Bn | Avg Fund Size: $174.8M | 2.0 x Sample: 62 Funds Total Capital: $10.6Bn | Avg Fund Size: $170.8M | 25.8% Sample: 43 Funds Total Capital: $3.8Bn | Avg Fund Size: $88.1M | 1.9 x Sample: 47 Funds Total Capital: $4.2Bn | Avg Fund Size: $88.4M | 29.7% Sample: 11 Funds Total Capital: $4Bn | Avg Fund Size: $365.3M | 2.4 x Sample: 11 Funds Total Capital: $4.1Bn | Avg Fund Size: $373M | Small Data Sample 25.2% Sample: 4 FundsTotal Capital: $2.3Bn | Avg Fund Size: $582.5M | Small Data Sample 1.7 x Sample: 4 FundsTotal Capital: $2.3Bn | Avg Fund Size: $582.5M | |
| All Data Pooled Return | 33.5% Sample: 241 Funds Total Capital: $79.2Bn | Avg Fund Size: $328.6M | 2.2 x Sample: 229 Funds Total Capital: $80.7Bn | Avg Fund Size: $352.3M | 30.4% Sample: 136 Funds Total Capital: $14.7Bn | Avg Fund Size: $108M | 2.3 x Sample: 121 Funds Total Capital: $12.5Bn | Avg Fund Size: $103.7M | 32.9% Sample: 64 Funds Total Capital: $23.2Bn | Avg Fund Size: $363M | 2.2 x Sample: 65 Funds Total Capital: $23.5Bn | Avg Fund Size: $361.5M | 35.0% Sample: 41 Funds Total Capital: $41.3Bn | Avg Fund Size: $1006.5M | 2.2 x Sample: 43 Funds Total Capital: $44.6Bn | Avg Fund Size: $1037.7M |
Within this trend, there are some very interesting sub-trends that can be identified based on factors such as fund size, Platform focus, and more, which will be explored in the remaining sections of this study.
“We are strong supporters of platform teams working to drive value creation and believe they are powerful resources for venture firms to support their portfolios. From the LP perspective, it seems like a wise investment of fees at the firm level to help generate returns. As data nerds ourselves, it’s terrific to see this type of data-backed analysis being done to recognize the correlation between the work of platform teams and returns so we can better identify attributes of and opportunities for outperformance.”

Nate Leung
PartnerSapphire PartnersFund Performance By Fund Size
The data also shows that the impact of Platform on fund returns is consistent across funds of all sizes.
Small Funds (Less than $250M)
For vintage years 2000 – 2009, smaller funds less than $250M categorized as having Significant Platform outperformed funds categorized as No Platform by 750 basis points and the pooled average by 590 basis points when comparing Net IRR. Similarly, when comparing TVPI, funds categorized as Significant Platform outperformed funds categorized as No Platform by 0.3x and the pooled average by 0.1x.
For vintage years 2010 – 2019, smaller funds categorized as having Significant Platform outperformed funds categorized as No Platform by 1,160 basis points and the pooled average by 740 basis points when comparing Net IRR. Similarly, when comparing TVPI, funds categorized as Significant Platform outperformed funds categorized as No Platform by 0.9x and the pooled average by 0.5x.
| 2000-2009 Fund Vintage Pooled Investment Returns | 2010-2019 Fund Vintage Pooled Investment Returns | Pooled Investment ReturnsNet IRR | Pooled Investment ReturnsNet Multiple (TVPI) | Pooled Investment ReturnsNet IRR | Pooled Investment ReturnsNet Multiple (TVPI) |
|---|---|---|---|---|
| 13.1% Sample: 11 Funds Total Capital: $1.3Bn | Avg Fund Size: $118.3M | 2.5 x Sample: 10 Funds Total Capital: $1.2Bn | Avg Fund Size: $119M | 33.5% Sample: 86 Funds Total Capital: $9.4Bn | Avg Fund Size: $109.6M | 3.3 x Sample: 73 Funds Total Capital: $7.7Bn | Avg Fund Size: $104.9M | |
| 10.5% Sample: 29 Funds Total Capital: $4.2Bn | Avg Fund Size: $144.9M | 2.7 x Sample: 25 Funds Total Capital: $3.9Bn | Avg Fund Size: $157.5M | 20.6% Sample: 51 Funds Total Capital: $6.3Bn | Avg Fund Size: $123.4M | 2.8 x Sample: 41 Funds Total Capital: $5Bn | Avg Fund Size: $121.9M | |
| 4.7% Sample: 77 Funds Total Capital: $8.7Bn | Avg Fund Size: $112.9M | 2.2 x Sample: 92 Funds Total Capital: $9.8Bn | Avg Fund Size: $107M | 21.9% Sample: 97 Funds Total Capital: $8.5Bn | Avg Fund Size: $87.2M | 2.4 x Sample: 99 Funds Total Capital: $8.6Bn | Avg Fund Size: $86.5M | |
| 7.2% Sample: 117 Funds Total Capital: $14.2Bn | Avg Fund Size: $121.4M | 2.4 x Sample: 127 Funds Total Capital: $15Bn | Avg Fund Size: $117.9M | 26.1% Sample: 234 Funds Total Capital: $24.2Bn | Avg Fund Size: $103.3M | 2.8 x Sample: 213 Funds Total Capital: $21.2Bn | Avg Fund Size: $99.6M | |
Midsized Funds ($250M - $500M)
For vintage years 2000 – 2009, mid-sized funds ($250M – $500M) categorized as having Significant Platform outperformed funds categorized as No Platform by 750 basis points and the pooled average by 580 basis points when comparing Net IRR. Similarly, when comparing TVPI, funds categorized as Significant Platform outperformed funds categorized as No Platform by 0.3x and the pooled average by 0.2x.
For vintage years 2010 – 2019, mid-sized funds ($250M – $500M)categorized as having Significant Platform outperformed funds categorized as No Platform by 840 basis points and the pooled average by 440 basis points when comparing Net IRR. When comparing TVPI, funds categorized as Significant Platform outperformed funds categorized as No Platform by 0.6x and the pooled average by 0.1x. Notably, when compared by TVPI, funds categorized as Moderate Platform marginally outperform those categorized as Significant Platform by 0.1x; both perform better than the pooled average.
| 2000-2009 Fund Vintage Pooled Investment Returns | 2010-2019 Fund Vintage Pooled Investment Returns | Pooled Investment ReturnsNet IRR | Pooled Investment ReturnsNet Multiple (TVPI) | Pooled Investment ReturnsNet IRR | Pooled Investment ReturnsNet Multiple (TVPI) |
|---|---|---|---|---|
| 11.8% Sample: 8 Funds Total Capital: $3Bn | Avg Fund Size: $371.3M | 1.9 x Sample: 9 Funds Total Capital: $3.4Bn | Avg Fund Size: $376.7M | 33.1% Sample: 38 Funds Total Capital: $14.1Bn | Avg Fund Size: $370.2M | 2.8 x Sample: 39 Funds Total Capital: $14.2Bn | Avg Fund Size: $362.8M | |
| 7.1% Sample: 26 Funds Total Capital: $9.6Bn | Avg Fund Size: $368.2M | 1.9 x Sample: 27 Funds Total Capital: $10Bn | Avg Fund Size: $371.9M | 26.8% Sample: 53 Funds Total Capital: $19.5Bn | Avg Fund Size: $367.3M | 2.9 x Sample: 50 Funds
Total Capital: $18.1Bn | Avg Fund Size: $361.6M | |
| 4.4% Sample: 46 Funds Total Capital: $15.9Bn | Avg Fund Size: $346.2M | 1.6 x Sample: 47 Funds Total Capital: $16.4Bn | Avg Fund Size: $349M | 24.8% Sample: 17 Funds Total Capital: $5.9Bn | Avg Fund Size: $346.1M | 2.2 x Sample: 18 Funds Total Capital: $6.3Bn | Avg Fund Size: $352.6M | |
| All Data Pooled Return | 6.1% Sample: 80 Funds Total Capital: $28.5Bn | Avg Fund Size: $355.9M | 1.7 x Sample: 83 Funds Total Capital: $29.8Bn | Avg Fund Size: $359.5M | 29.5% Sample: 108 Funds Total Capital: $39.4Bn | Avg Fund Size: $365M | 2.7 x Sample: 107 Funds Total Capital: $38.6Bn | Avg Fund Size: $360.5M |
Large Funds (More than $500M)
For vintage years 2000 – 2009, large funds (more than $500M) categorized as having Significant Platform outperformed funds categorized as No Platform by 260 basis points and the pooled average by 20 basis points when comparing Net IRR. Similarly, when comparing TVPI, funds categorized as Significant Platform outperformed funds categorized as No Platform by 0.2x, however they underperformed the pooled average by 0.1x. It is interesting to note that funds categorized as Moderate Platform outperformed Significant Platform funds by 80 basis points, No Platform by 340 basis points and the pooled average by 100 basis points when comparing Net IRR. Similarly, funds categorized as Moderate Platform outperformed Significant Platform funds by 0.2x, No Platform by 0.4x and the pooled average by 0.1x when comparing TVPI.
For vintage years 2010 – 2019, large funds (more than $500M) categorized as having Significant Platform outperformed funds categorized as No Platform by 1,420 basis points and the pooled average by 200 basis points when comparing Net IRR. Similarly, when comparing TVPI, funds categorized as Significant Platform outperformed funds categorized as No Platform by 0.9x and the pooled average by 0.1x.
| 2000-2009 Fund Vintage Pooled Investment Returns | 2010-2019 Fund Vintage Pooled Investment Returns | Pooled Investment ReturnsNet IRR | Pooled Investment ReturnsNet Multiple (TVPI) | Pooled Investment ReturnsNet IRR | Pooled Investment ReturnsNet Multiple (TVPI) |
|---|---|---|---|---|
| 6.1% Sample: 8 Funds Total Capital: $7.1Bn | Avg Fund Size: $889M | 1.5 x Sample: 8 Funds Total Capital: $7.1Bn | Avg Fund Size: $889M | 33.1% Sample: 23 Funds Total Capital: $19.4Bn | Avg Fund Size: $845.5M | 2.6 x Sample: 20 Funds Total Capital: $18.2Bn | Avg Fund Size: $911.4M | |
| 6.9% Sample: 34 Funds Total Capital: $35.7Bn | Avg Fund Size: $1050.8M | 1.7 x Sample: 37 Funds Total Capital: $37.9Bn | Avg Fund Size: $1023.4M | 31.4% Sample: 33 Funds Total Capital: $34.9Bn | Avg Fund Size: $1057.9M | 2.5 x Sample: 39 Funds Total Capital: $42.2Bn | Avg Fund Size: $1082.1M | |
| 3.5% Sample: 17 Funds Total Capital: $15Bn | Avg Fund Size: $884.5M | 1.3 x Sample: 18 Funds Total Capital: $15.9Bn | Avg Fund Size: $885.1M | 18.9% Sample: 6 Funds Total Capital: $3.8Bn | Avg Fund Size: $638.3M | 1.7 x Sample: 6 Funds Total Capital: $3.8Bn | Avg Fund Size: $638.3M | |
| 5.9% Sample: 59 Funds Total Capital: $57.9Bn | Avg Fund Size: $981M | 1.6 x Sample: 63 Funds Total Capital: $60.9Bn | Avg Fund Size: $966.8M | 31.1% Sample: 62 Funds Total Capital: $58.2Bn | Avg Fund Size: $938.5M | 2.5 x Sample: 65 Funds Total Capital: $64.3Bn | Avg Fund Size: $988.6M | |
Fund Performance by Platform Focus
As noted above, this study categorized Platform professionals into one of 6 specializations (Marketing, Community, Investment Operations, Talent, Business Development, and ESG). These specializations were then categorized into either Pre-Investment or Post Investment focused. This study investigated the correlation between fund performance and Platform focus in Pre and / or Post Investment Platform for 2010 – 2019 vintages.
Small Funds (Less than $250M)
For smaller funds, funds that are categorized as having a Primarily Pre-Investment Platform Focus were the best performing funds, outperforming No Platform by 840 basis points and the pooled average by 450 basis points. Similarly, when comparing TVPI, funds categorized as Primarily Pre-Investment Platform Focus outperformed funds categorized as No Platform by 0.8x and the pooled average by 0.5x.
Primarily Pre-Investment Platform Focus is the second most common Platform approach for these funds, accounting for 39% of all funds (with No Platform being the most common strategy with 47% of smaller funds). Those smaller funds that have a Pre- and Post-Investment Platform Focus generated returns in line with the pooled average, however those funds under $250M that follow a Primarily Post-Investment Platform Focus underperformed all categories. The likely reason is that smaller funds are the largest percentage of this dataset and the most common funds in the venture capital industry. Focusing on Pre-Investment Platform efforts, such as Marketing and Community, that enhance the firm’s brand, help differentiate the firm’s brand, and enable the fund to attract and win the best investments.
Midsized Funds ($250M - $500M)
For midsized funds, funds that are categorized as having a Pre- and Post-Investment Platform Focus were the best performing funds based on Net IRR, outperforming No Platform by 740 basis points and the pooled average by 310 basis points. Although, when comparing TVPI, funds categorized as Pre- and Post-Investment Platform Focus outperformed funds categorized as No Platform by only 0.1x and underperformed the pooled average by 0.4x. The best performing funds based on TVPI were funds categorized as having a Primarily Pre-Investment Platform Focus, which outperformed No Platform by 1.1x and the pooled average by 0.5x. When compared by Net IRR, Primarily Pre-Investment Platform Focus outperformed No Platform by 530 basis points and the pooled average by 100 basis points (slightly lower than Pre- and Post-Investment Platform Focus).
For midsized funds, these were the two most common Platform approaches with 52% of funds categorized as having a Primarily Pre-Investment Platform Focus and 24% of funds categorized as Pre- and Post-Investment Platform Focus. Only 20% of midsized funds were categorized as No Platform.
Large Funds (More than $500M)
The set of large funds that correspond to the highest fund returns is very different from the small and mid-sized funds. Those that have a Primarily Post-Investment Platform Focus (and therefore do very little in terms of Marketing, Community and pre-investment Platform efforts) have, by a far margin, the strongest returns of all fund groups with a Net IRR of 40.6%, outperforming No Platform by 2,300 basis points and the pooled average by 950 basis points. Similarly, when comparing TVPI, funds categorized as Primarily Post-Investment Platform Focus outperformed funds categorized as No Platform by 1.6x and the pooled average by 0.7x.
Large funds often have strong brands and fewer peer funds to compete against, which is potentially why they may not invest in Marketing and Community as much. The second highest fund group based on Net IRR are those that follow a Platform focus of both Pre- and Post-Investment Platform Focus, which outperforms No Platform by 1,620 basis points and the pooled average by 270 basis points. When compared by TVPI, Primarily Pre-Investment Platform Focus performs slightly higher (0.6x) than Pre- and Post-Investment Platform Focus or 0.3x better than the pooled average and 1.2x better than No Platform. The starkest contrast in returns is the funds that have No Platform, which produce a Net IRR of 17.6%, 1,350 basis points below than the pooled average, and a 1.6x TVPI, 0.9x below the pooled average.
2010-2019
Funds Less Than $250M
| $250M - $500M Pooled Net IRR | Funds Over $500M Pooled Net IRR | |
|---|---|---|---|
| 26.9%
Sample: 23 Funds Total Capital: $3Bn | Avg Fund Size: $131.8M | 31.9% Sample: 26 Funds Total Capital: $9.5Bn | Avg Fund Size: $365.9M | 33.8% Sample: 19 Funds Total Capital: $25.8Bn | Avg Fund Size: $1355.9M | |
| 18.9% Sample: 10 Funds Total Capital: $1.2Bn | Avg Fund Size: $118.7M | Small Data Sample 17.7% Sample: 4 FundsTotal Capital: $1.6Bn | Avg Fund Size: $402.4M | 40.6% Sample: 9 Funds Total Capital: $7.8Bn | Avg Fund Size: $867.2M | |
| 30.6% Sample: 91 Funds Total Capital: $10.1Bn | Avg Fund Size: $110.9M | 29.8% Sample: 56 Funds Total Capital: $20.5Bn | Avg Fund Size: $366.1M | 27.0% Sample: 27 Funds Total Capital: $20.4Bn | Avg Fund Size: $754.2M | |
| 22.2% Sample: 110 Funds Total Capital: $9.9Bn | Avg Fund Size: $89.6M | 24.4% Sample: 22 Funds Total Capital: $7.8Bn | Avg Fund Size: $354.3M | 17.6% Sample: 7 Funds Total Capital: $4.5Bn | Avg Fund Size: $636.4M | |
| 26.1% Sample: 234 Funds Total Capital: $24.2Bn | Avg Fund Size: $103.3M | 28.7% Sample: 108 Funds Total Capital: $39.4Bn | Avg Fund Size: $365M | 31.1% Sample: 62 Funds Total Capital: $58.2Bn | Avg Fund Size: $938.5M |
2010-2019
Funds Less Than $250MNet Multiple (TVPI) | $250M - $500M Net Multiple (TVPI) | Funds Over $500M Net Multiple (TVPI) | |
|---|---|---|---|
| 2.8 x
Sample: 17 Funds Total Capital: $1.9Bn | Avg Fund Size: $113M | 2.3 x Sample: 26 Funds Total Capital: $9.2Bn | Avg Fund Size: $354.9M | 2.2 x Sample: 19 Funds Total Capital: $25.8Bn | Avg Fund Size: $1355.9M | |
| 2.2 x Sample: 8 Funds Total Capital: $1Bn | Avg Fund Size: $124.9M | Small Data Sample 2.4 x Sample: 5 FundsTotal Capital: $1.9Bn | Avg Fund Size: $388.7M | 3.2 x Sample: 9 Funds Total Capital: $7.8Bn | Avg Fund Size: $867.2M | |
| 3.3 x Sample: 77 Funds Total Capital: $8.4Bn | Avg Fund Size: $109M | 3.2 x Sample: 23 Funds Total Capital: $8.3Bn | Avg Fund Size: $360.4M | 2.8 x Sample: 29 Funds Total Capital: $25.6Bn | Avg Fund Size: $884.4M | |
| 2.5 x Sample: 111 Funds Total Capital: $9.9Bn | Avg Fund Size: $89.2M | 2.2 x Sample: 23 Funds Total Capital: $8.3Bn | Avg Fund Size: $360.4M | 1.6 x Sample: 8 Funds Total Capital: $5Bn | Avg Fund Size: $630.8M | |
| 2.8 x Sample: 213 Funds Total Capital: $21.2Bn | Avg Fund Size: $99.6M | 2.7 x Sample: 107 Funds Total Capital: $38.6Bn | Avg Fund Size: $360.5M | 2.5 x Sample: 65 Funds Total Capital: $64.3Bn | Avg Fund Size: $988.6M |
“Platform has shown to be impactful at VC firms of all sizes and maturity levels, with small and early-stage investors gaining value from pre-investment Platform efforts that define their brands and improve their awareness amongst entrepreneurs. And later-stage, established funds have seen the significant impact from post-investment Platform strategies that offer support to their portfolio companies, serving as a key differentiator from firms that have not invested in Platform.”

Dale Chang
Operating PartnerScale Venture PartnersThe findings of this report show the increasing importance of the platform function in recent years and is a good indication that firms will need to continue investing in pre and post platform initiatives as the market becomes more saturated. As the competition for deals heats up and founders seek more than just funding, VCs will need to continue to differentiate themselves by providing value beyond just capital, through their Platform efforts. The evolution of this function is likely to continue, with firms investing more in specialized teams and technology platforms to provide a competitive edge. As for its impact on fund returns, the results of the research proves that value add and Platform functions can have a significant positive effect on portfolio company success and, in turn, fund returns. As such, we can expect to see more venture capital firms across the globe adopt and invest in Platform in the years to come.
About Vc Platform Community
The VC Platform Global Community is the largest dedicated group of VC Platform professionals in the venture capital industry. Formed in 2013, our membership of peers has grown into a community of the world’s best Platform professionals who work to advance the industry while supporting individual career growth. Our vision is to collaboratively elevate the profession globally by recognizing and propagating standards of excellence in our work. VC Platform operates to benefit the membership community, the portfolio companies we serve, and the VC industry at large. At the time of publication, the community has 1,800+ members distributed in 40+ countries and represents over half of the global Platform industry who are members of the community. Our membership spans 900+ firms and $2.4+ trillion dollars in collective assets under management.
Since its inception in 2013, this community has played an immensely pivotal role in standardizing the understanding and best practices of the platform role. Our members convene on a private community forum and through various events throughout the year to share learnings, build relationships, and tackle problems together. In many ways, the growth and strong health of this community represents both the professionalization of the Platform and how important the role continues to be especially in turbulent economic times. The VC Platform community is the impetus to creating the power of this role and continues to elevate the profession and those leading within it.
Based on analysis from this report, it is estimated that as of December 2022 there were 3,100 VC Platform Professionals Globally in the industry. The VC Platform Community is proud to be growing at a rapid pace alongside the growth of this industry, with over 50% of the global Platform workforce actively maintaining membership in the Community. Platform professionals who are not currently part of the community can apply to join here.
“The Platform function is the fastest growing career path in venture capital at present, now representing the highest proportion of an employee base at firms it has ever seen. As more funds start up and deals become increasingly competitive, Platform - done well - is rightfully understood as a competitive advantage worth investing in.”

Joshua Goodfield
Executive DirectorVC Platform Global CommunityResearch Methodology
For any questions about the research approach and methodology used for this study, please contact the study’s lead authors Cory Bolotsky at cory@vcplatform.com and Dale Chang at dale@scalevp.com.
Firm Headcount Research Methodology
For this research we focused our dataset on firms that identify primarily as venture capital firms in the United States and Canada with at least one fund of a 2000 to 2019 vintage of $10M USD. This data set provided us with 850 firms that we were able to acquire data for.
For the 850 firms, we worked with a data collection team to identify every employee who ever worked at the firm based on information available on LinkedIn and identified 76,072 individual employment records across those firms (after removing accounts identified as ‘bots’ or ‘spam accounts’). Employment records, based on our data set, are any one employment period on an individual’s LinkedIn profile. For example, if one individual held two unique job titles at Firm A and one job title at Firm B, and both Firm A and Firm B are included in our data set, that individual would have three total employment records in our dataset. We then used each individual’s job title to categorize their role into one of 9 job categories within venture capital (Investor, Technology & Software Engineering, Operations, Research & Data Science, Finance, Tax & Accounting, Investor Relations, Legal & Compliance, Platform, Other). For Platform roles, we further categorized job titles, when possible, into 6 sub categories, or specializations, (Talent, Marketing, ESG, Business Development, Community, Investment Operations). The categories were selected based on membership data available from the VC Platform Global Community as well as industry research and insights. These categories were assigned across 17,973 unique job titles. The assignment was done manually by the study’s lead researchers who intimately knows the venture capital profession. As part of this assignment, many of the 76,072 individuals were removed from the data set that were categorized as administrative professionals, non-permanent employees (eg. Fellows, Interns, Advisors, Externs, Entrepreneurs in Residence, Contractors, Consultants) or contained erroneous data based on the job titles and other information provided on each LinkedIn profile. The removal of administrative professionals and other similar roles was done to limit the reports research scope to the Core Team members of a firm. We also removed data on all individuals in the dataset who were not based in the United States or Canada based on their LinkedIn profile. Additional data sanitization was done to remove any duplicate records or overlapping records, for example if one individual stated to hold two full-time roles during the same time period on their LinkedIn profile. This resulted in a final data set of 29,400 individual employment records.
Based on this data, we calculated the total headcount that each of the 850 venture firms in our sample had in each year from 2000 – 2022. When an individual was identified as joining or leaving a firm mid-year, we calculated them as a fractional employee accounting for the percentage of the year they were in that role based on their LinkedIn profile. For example, if an individual worked at a firm from July 2015 – February 2017, they’d be calculated as: 2015 = 0.50, 2016 = 1.00, 2017 = 0.17. We then used the 9 job title categories to calculate what the headcount percentage breakdown was for each job title category in each year for each firm. These percentages were used as key input calculations across much of the analysis in the study.
Firm Headcount Assets Under Management Classification
After determining each firm’s annual headcounts based on the research method above, firms were further classified by assets under management per year. The AUM calculation was made primarily with data from Preqin of all fund data from 1990 to 2022. For each firm, we calculated their annual AUM by summing the total amount of capital raised by that firm across all funds (inclusive of non-core funds) in each year from 2000 – 2022 accounting for funds raised 10 or less years from each specific year. 10 years was used as the typical fund lifespan; while a trend across the industry is for funds to take longer than 10 years to fully distribute realized returns, 10 years is typically the maximum time horizon where funds collect management fees, and therefore the length determined to use when correlating fund size with firm headcount (a management fee expense). Since we calculated all headcount on a full-year basis, we did the same for firm AUM and did not account for funds raised midway through the year.
The classification used for firm AUM is slightly different than fund AUM (explained below), as it takes into account multiple funds and, therefore the average firm AUM is much greater than the average fund size. The analysis in the report includes a few combined AUM groupings, but the primary classifications that were utilized to group firms were: Less than $250M USD, $250M – $500M USD, $500M – $1Bn USD, $1.0Bn – $2.5Bn USD and More than $2.5Bn USD.
Fund Returns Research Methodology
For our research we used a collection of data sources from Pitchbook and Preqin who provide fund returns data (including Net IRR and TVPI, also referred to as Net Multiple) based on public data sources, self-reported fund data and independent research. We focused our dataset on firms that identify primarily as venture capital firms in the United States and Canada with at least one fund of a 2000 to 2019 vintage of $10M USD or more.
From the returns data available in Pitchbook and Preqin, we manually sanitized the data to focus exclusively on “Core Funds” (removing secondary and non-core funds from our data set such as Entrepreneur Funds, Opportunity Funds, Global Funds, etc.) and only included funds that were greater than $10M. We then ensured that for any data included the fund returns data (Net IRR and TVPI / Net Multiple) were reported later than 1/1/2020, according to our data sources. The data provided by these data sources include a mix of realized and unrealized returns based on the reporting date and fund vintage. This left us with a data set of 754 unique funds across 308 firms to include in our data consideration (out of the 850 firms that we attempted to identify data for). 500 of the fund performance metrics were sourced from Preqin’s data and 254 were sourced from Pitchbook. When we received fund returns data from both data providers, we used the data coverage and reporting date to select the data source with the most recent and comprehensive data to use.
All analysis in this report was calculated using a Pooled Returns calculation method, which calculated the returns for any given group of funds combining the total fund sizes and fund returns of that group on a pooled basis. This method was used to avoid the potential impact that any single outlier fund could have on the research and factored in the portfolio approach that most institutional investors take when investing across the asset class. In other words, the data we are presenting should display a historical return profile for an LP that invested in a number of different funds within a specific research grouping.
Additional analysis was conducted in preparing this report on the data based on percentiles rankings of individual funds, however that data was not included in the final published version. The data findings based on percentile of individual funds was very consistent with the trends presented in this report based on pooled returns. Viewers interested in reviewing the percentile-based analysis can request access to it by contacting the report lead researchers.
Some funds in our dataset have IRR data but do not report TVPI, and others have TVPI data and do not report IRR. We did our best to get the most complete data set across our different data sources, however when only one return method was available, we only included that fund’s returns analysis by that metric. Because of this, sample sizes may differ for IRR and TVPI calculations throughout the report.
Platform Category Research Methodology
For each of the 754 funds we calculated a “Platform % Score”. The calculation was done using the Firm Headcount Research Methodology described above. For each fund we used the firm’s average Platform headcount percentage for the fund’s Typical Investing Period (which we define as the 4-year period of the fund’s vintage year and the three years to follow). For example, if a fund was a 2010 Vintage fund and the firm had 5.0% Platform headcount in 2010, 6.0% Platform headcount in 2011, 10.0% Platform headcount in 2012 and 15.0% Platform headcount in 2013, the Platform % Score for that specific fund would be 9.0%. That percentage represents the proportion of the entire core team over a cumulative four-year basis for the fund that was dedicated to Platform.
That percentage was then used to categorize funds based on Platform Category. The three categories were defined as: No Platform, Moderate Platform and Significant Platform. The framework was designed looking at historic trends in Platform concentration at funds and how headcount percentage aligns with a firm’s Platform approach. Based on that research, it was decided that Significant Platform would be used to categorize firms greater than or equal to 10% of their core team’s headcount focused on platform and Moderate Platform would be used for firms that have less than 10% of their core team’s headcount focused on platform, but more than 0.001%. Funds with less than 0.001% of their headcount dedicated to platform in a four-year time were categorized as having No Platform.
Fund Performance Classification Research Methodology
When analyzing the data to determine trends across the report, funds were classified by numerous attributes and characteristics. In the final report, three methods of classification were included to display the analyzed findings: Vintage Year, Fund Size and Platform Focus.
Vintage Year Classification
Each fund’s vintage year was provided by our data provider and is based on the year of first investment. If the year of first investment is unknown, the year of the final close is typically used as the vintage year. However, if a firm publicly declares via press release or a notice on their website a fund to be of a particular vintage different than either of the first conditions, the firm’s classification takes precedence.
Across the dataset, fund returns data varies significantly by vintage year, which made accurate classification of this data very important. The primary input that led to how vintage years were grouped was the pooled returns across the entire dataset (and broader research across the industry at large) to align grouping with consistent industry trends. These cyclical impacts were generally a result of macro-economic and industry wide trends that go beyond the scope of this research.
Based on that, we decided to classify the data into primary and secondary vintage year groups. The primary classification was by the 10-year periods of 2000 – 2009 and 2010 – 2019. The secondary classification was by the 5-year periods of 2000 – 2004, 2005 – 2009, 2010 – 2014 and 2015 – 2019. While there was some variety in pooled fund performance on an individual year basis within each primary and secondary classification, this grouping provided the most normalized view of the data compared across consistent peer sets.
Funds with vintage years of 2020 and greater were not included in the data set, as they are still actively within their Typical Investing Period (4-years). Additionally, those funds typically are earlier in their fund performance cycle and most of their fund performance data is based on primarily unrealized returns which may or may not matriculate. While unrealized returns are included in our analysis, limiting the vintage years included to 2000 – 2019 optimized for the most accurate view on realized and potential returns.
Fund Size Classification
Fund size data was provided by our data providers, and all funds included had at least $10M USD in capital. All fund sizes were converted and classified in USD by our data providers, when needed.
Based on the data, we elected to classify funds into three primary groups according to their fund size: Less than $250M USD, $250M to $500M USD, and Greater than $500M USD. This classification was made generally based on the industry trends and sample sizes available for the different groupings throughout the report.
Platform Focus Classification
This report uses 6 primary Platform specializations used to classify each individual’s role based on their Platform focus (Marketing, Community, Investment Operations, Talent, Business Development, ESG). Those six categories are each grouped based on their primary Platform Focus. Marketing, Community and Investment Operations are all considered primarily Pre-Investment Platform Focus areas. Talent, Business Development and ESG are all considered primarily Post-Investment Platform Focus areas.
Individual funds were then assessed based on the breakdown of their Platform headcount on a fund-vintage year basis to determine the fund’s primary Platform focus during that investing period. The analysis was done based on total cumulative employee counts. The Primary Platform Focus Categories were assigned based on this logic:
